The UX Conference
Dashboard Design
I completed this project in the role of a UI designer as part of my CPD certification accredited by the School of UX.
Background
The UX Conference is a leading design conference for UX professionals. This annual event dives into the latest trends, technologies, and tools shaping the UX/UI world. These conferences attract large audiences globally, both physically and virtually through their website www.theuxconf.com.
My Responsibilities
The UX Conference currently relies on Eventbrite for ticket sales and manages their ads performance across five different channels. In order to simplify their event management, I was tasked to create a one stop solution with a centralised dashboard.

Design Requirements
I began by understanding the business and design requirements, along with collecting all the relevant data and content.
Total net sales
A view of the total net sales will allow the business to easily determine profitability.
Number of spaces left
The advertising budget will be spent more efficiently if the spaces left are displayed.
Latest orders
This feature will allow organisers to quickly amend, refund and export a receipt, with the ability to search by ticket buyer’s name or order number.
Customer locations
Viewing customer locations is useful as it allows business to see where it’s worth investing advertising budget in the future.
Website traffic
Tracking the website traffic will allow organisation to see effectiveness of marketing campaigns.
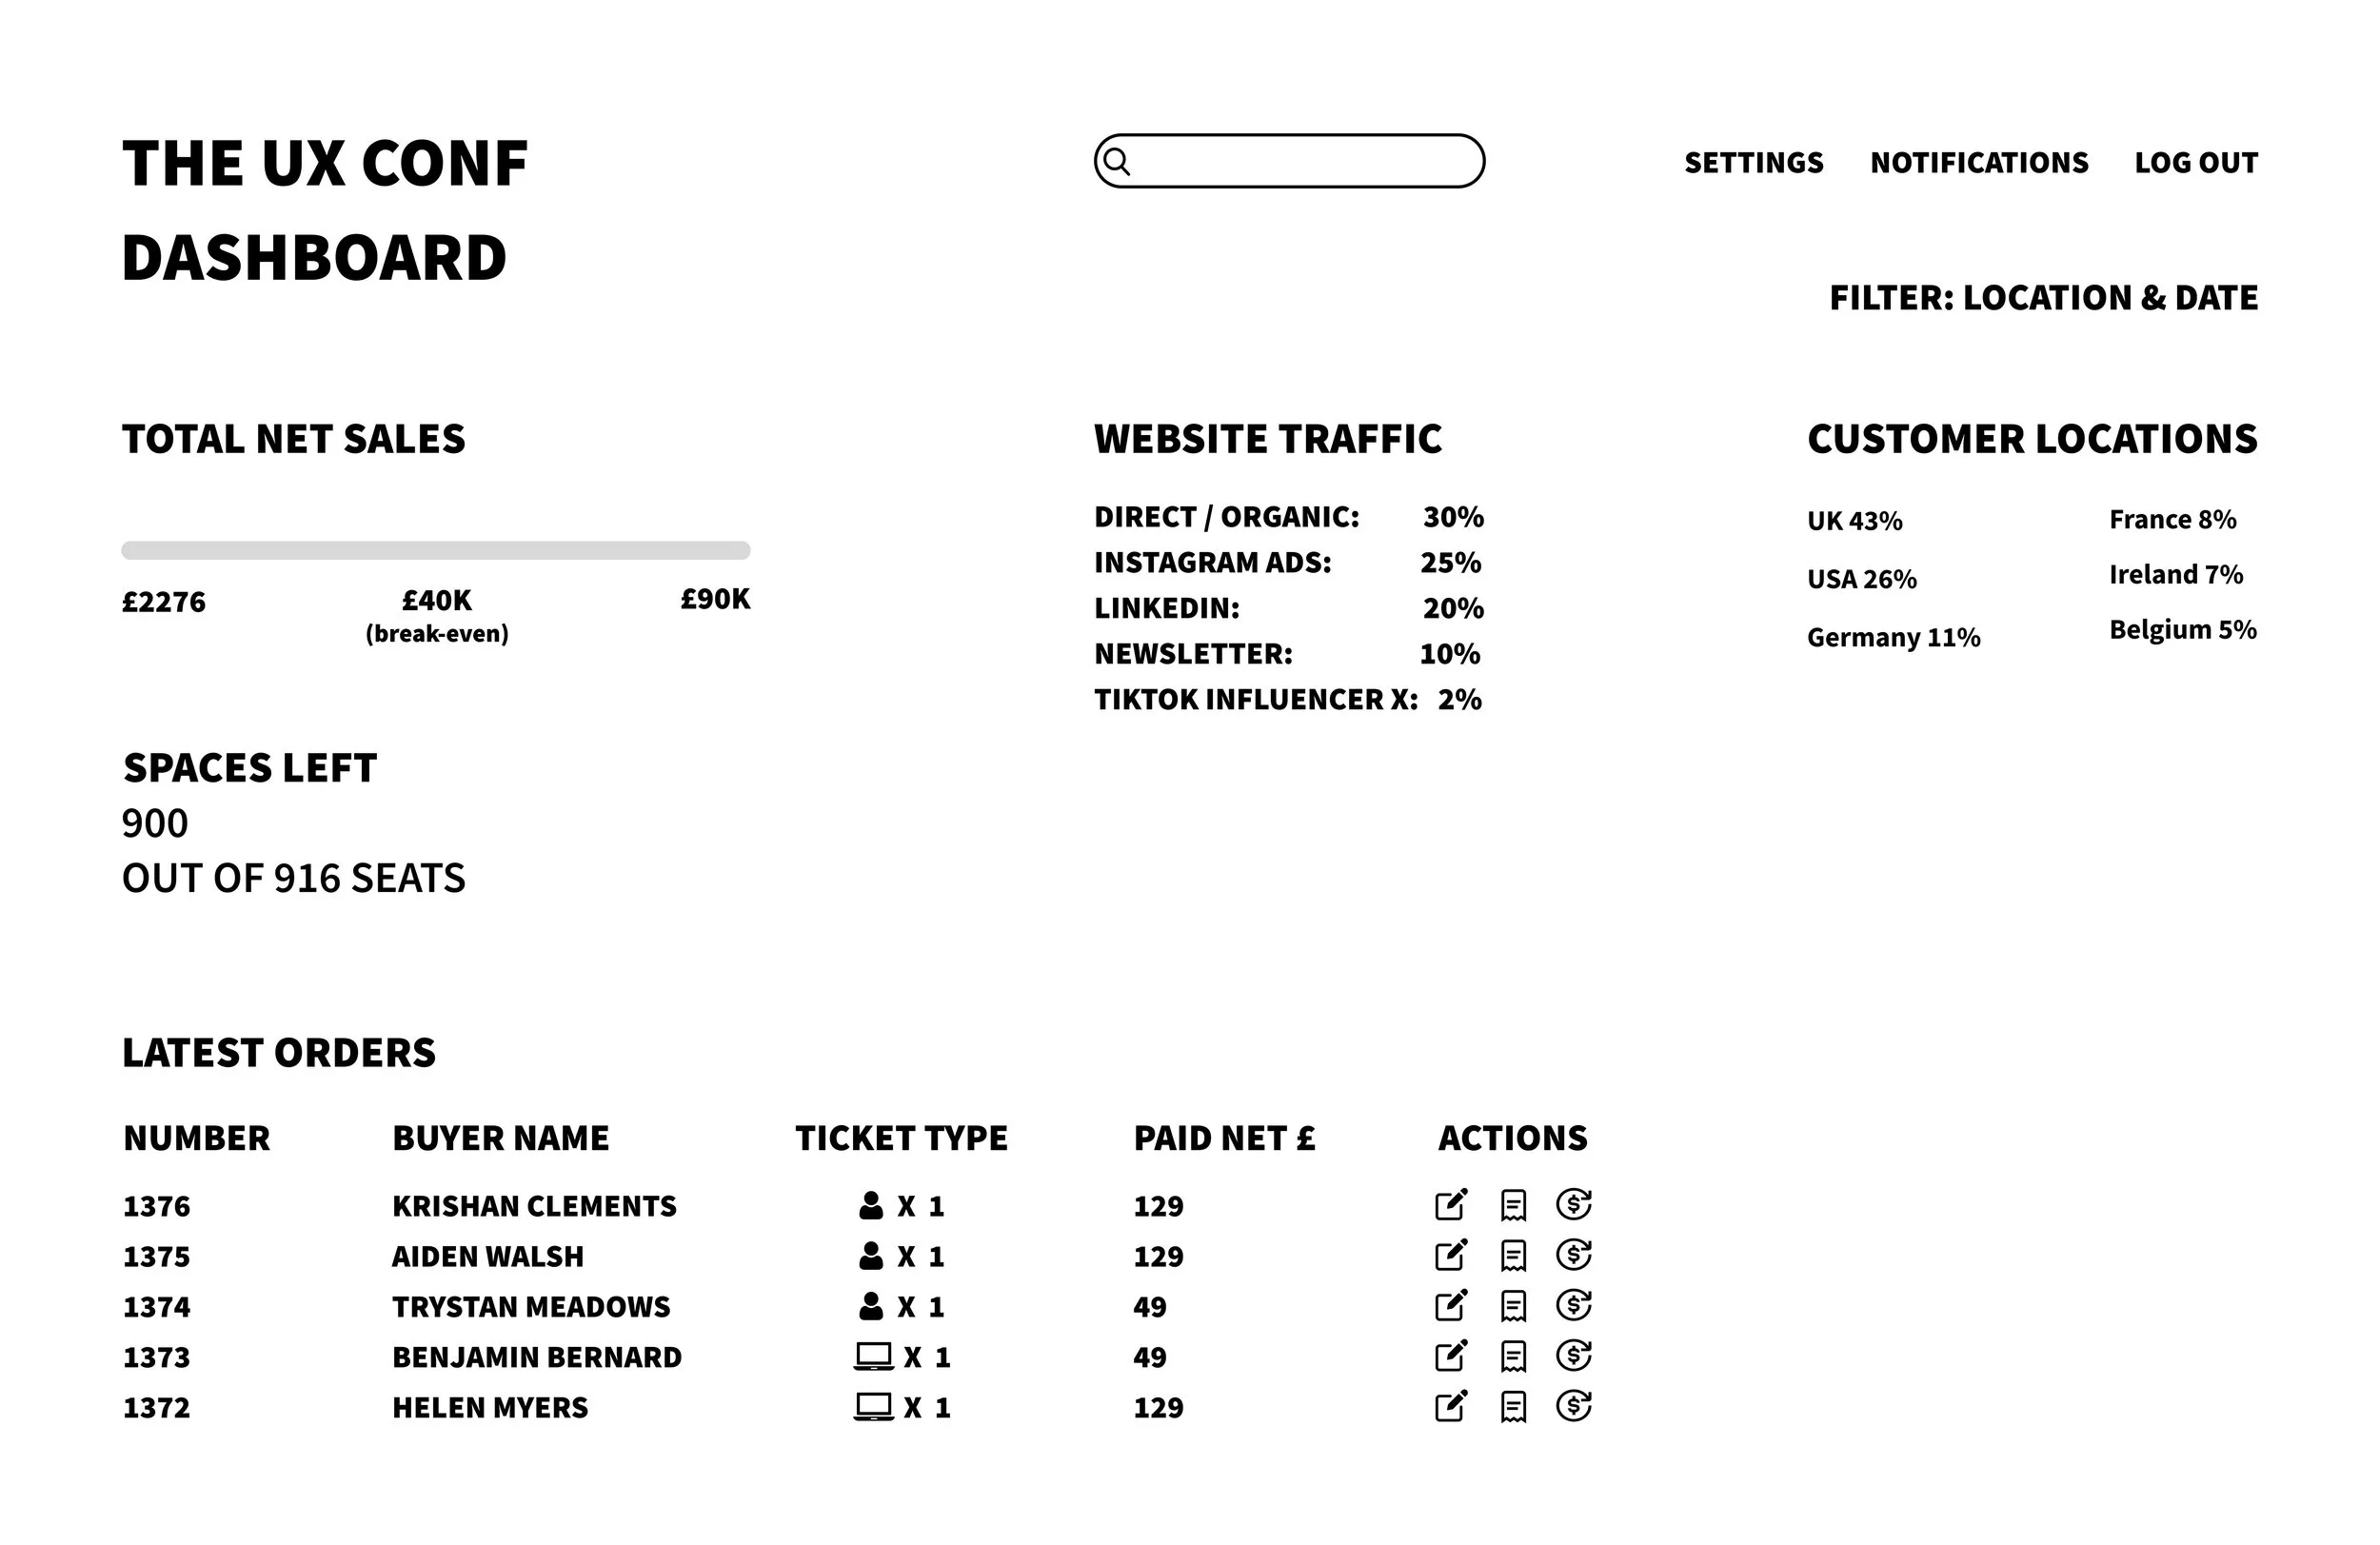
Low-Fidelity Wireframe
After gathering the necessary data and content, I created a wireframe to ensure a user friendly experience and a well structured layout.
Grid Systems
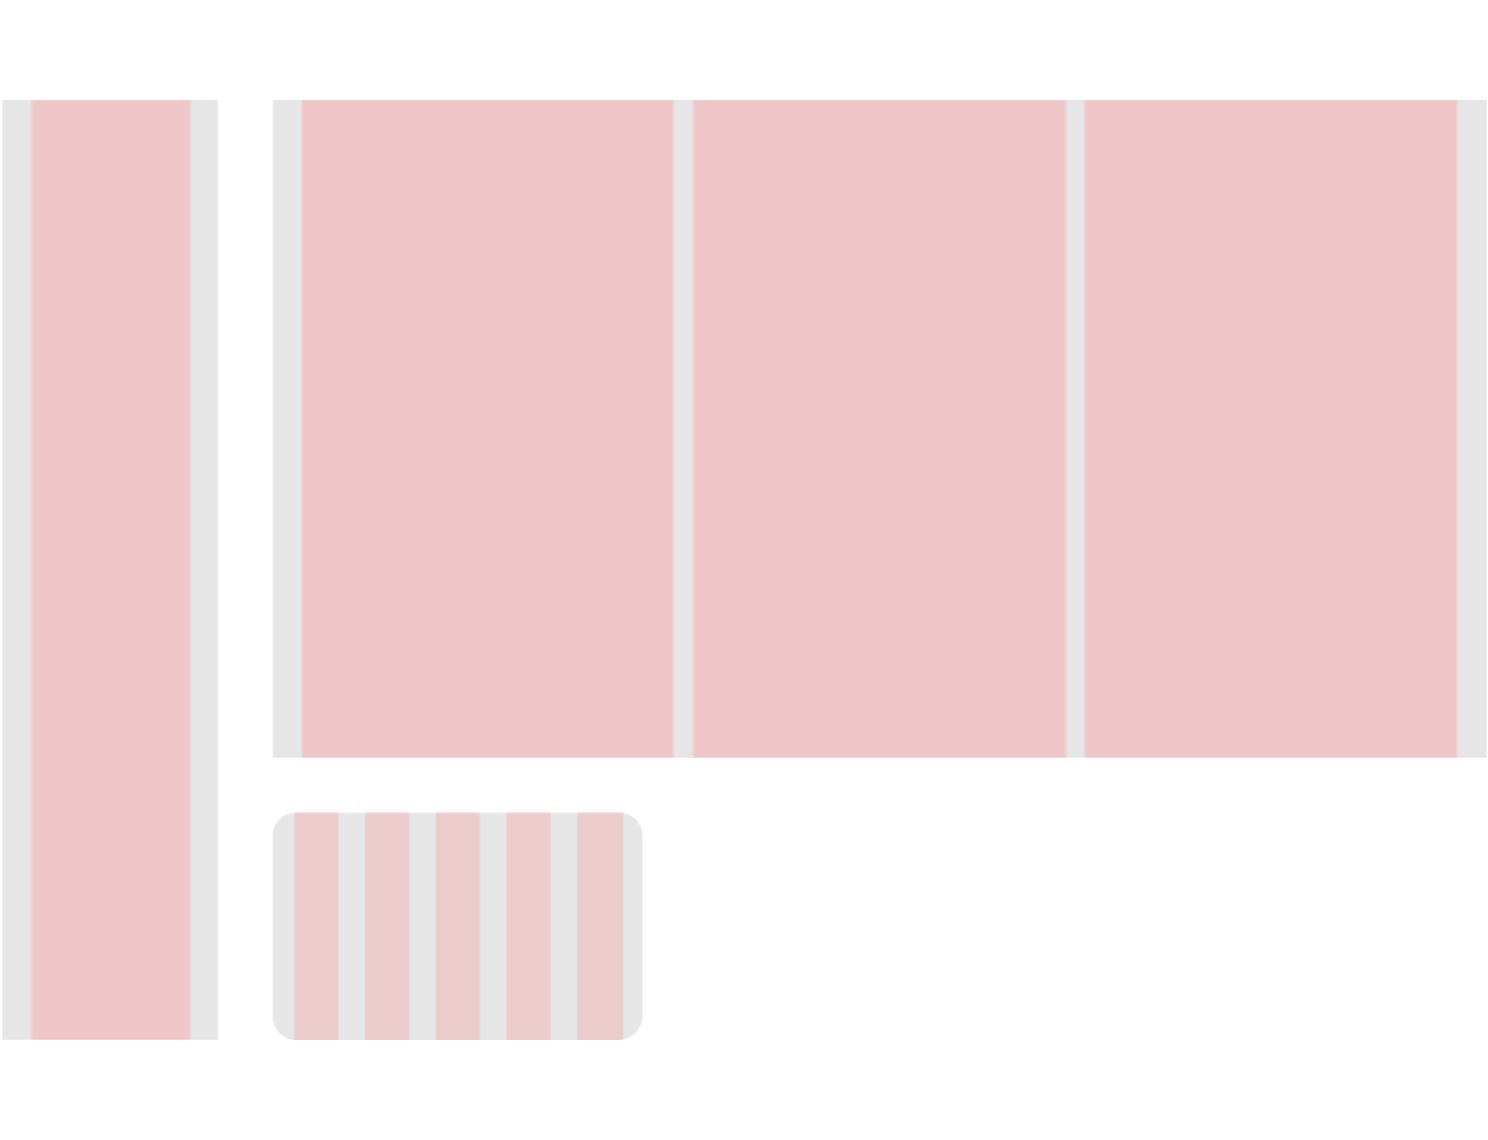
Navigation
Column: 1
Margin: 30
Gutter: 20
Tile
Column: 5
Margin: 20
Gutter: 25
Radius: 20
Body
Column: 3
Margin: 30
Gutter: 20
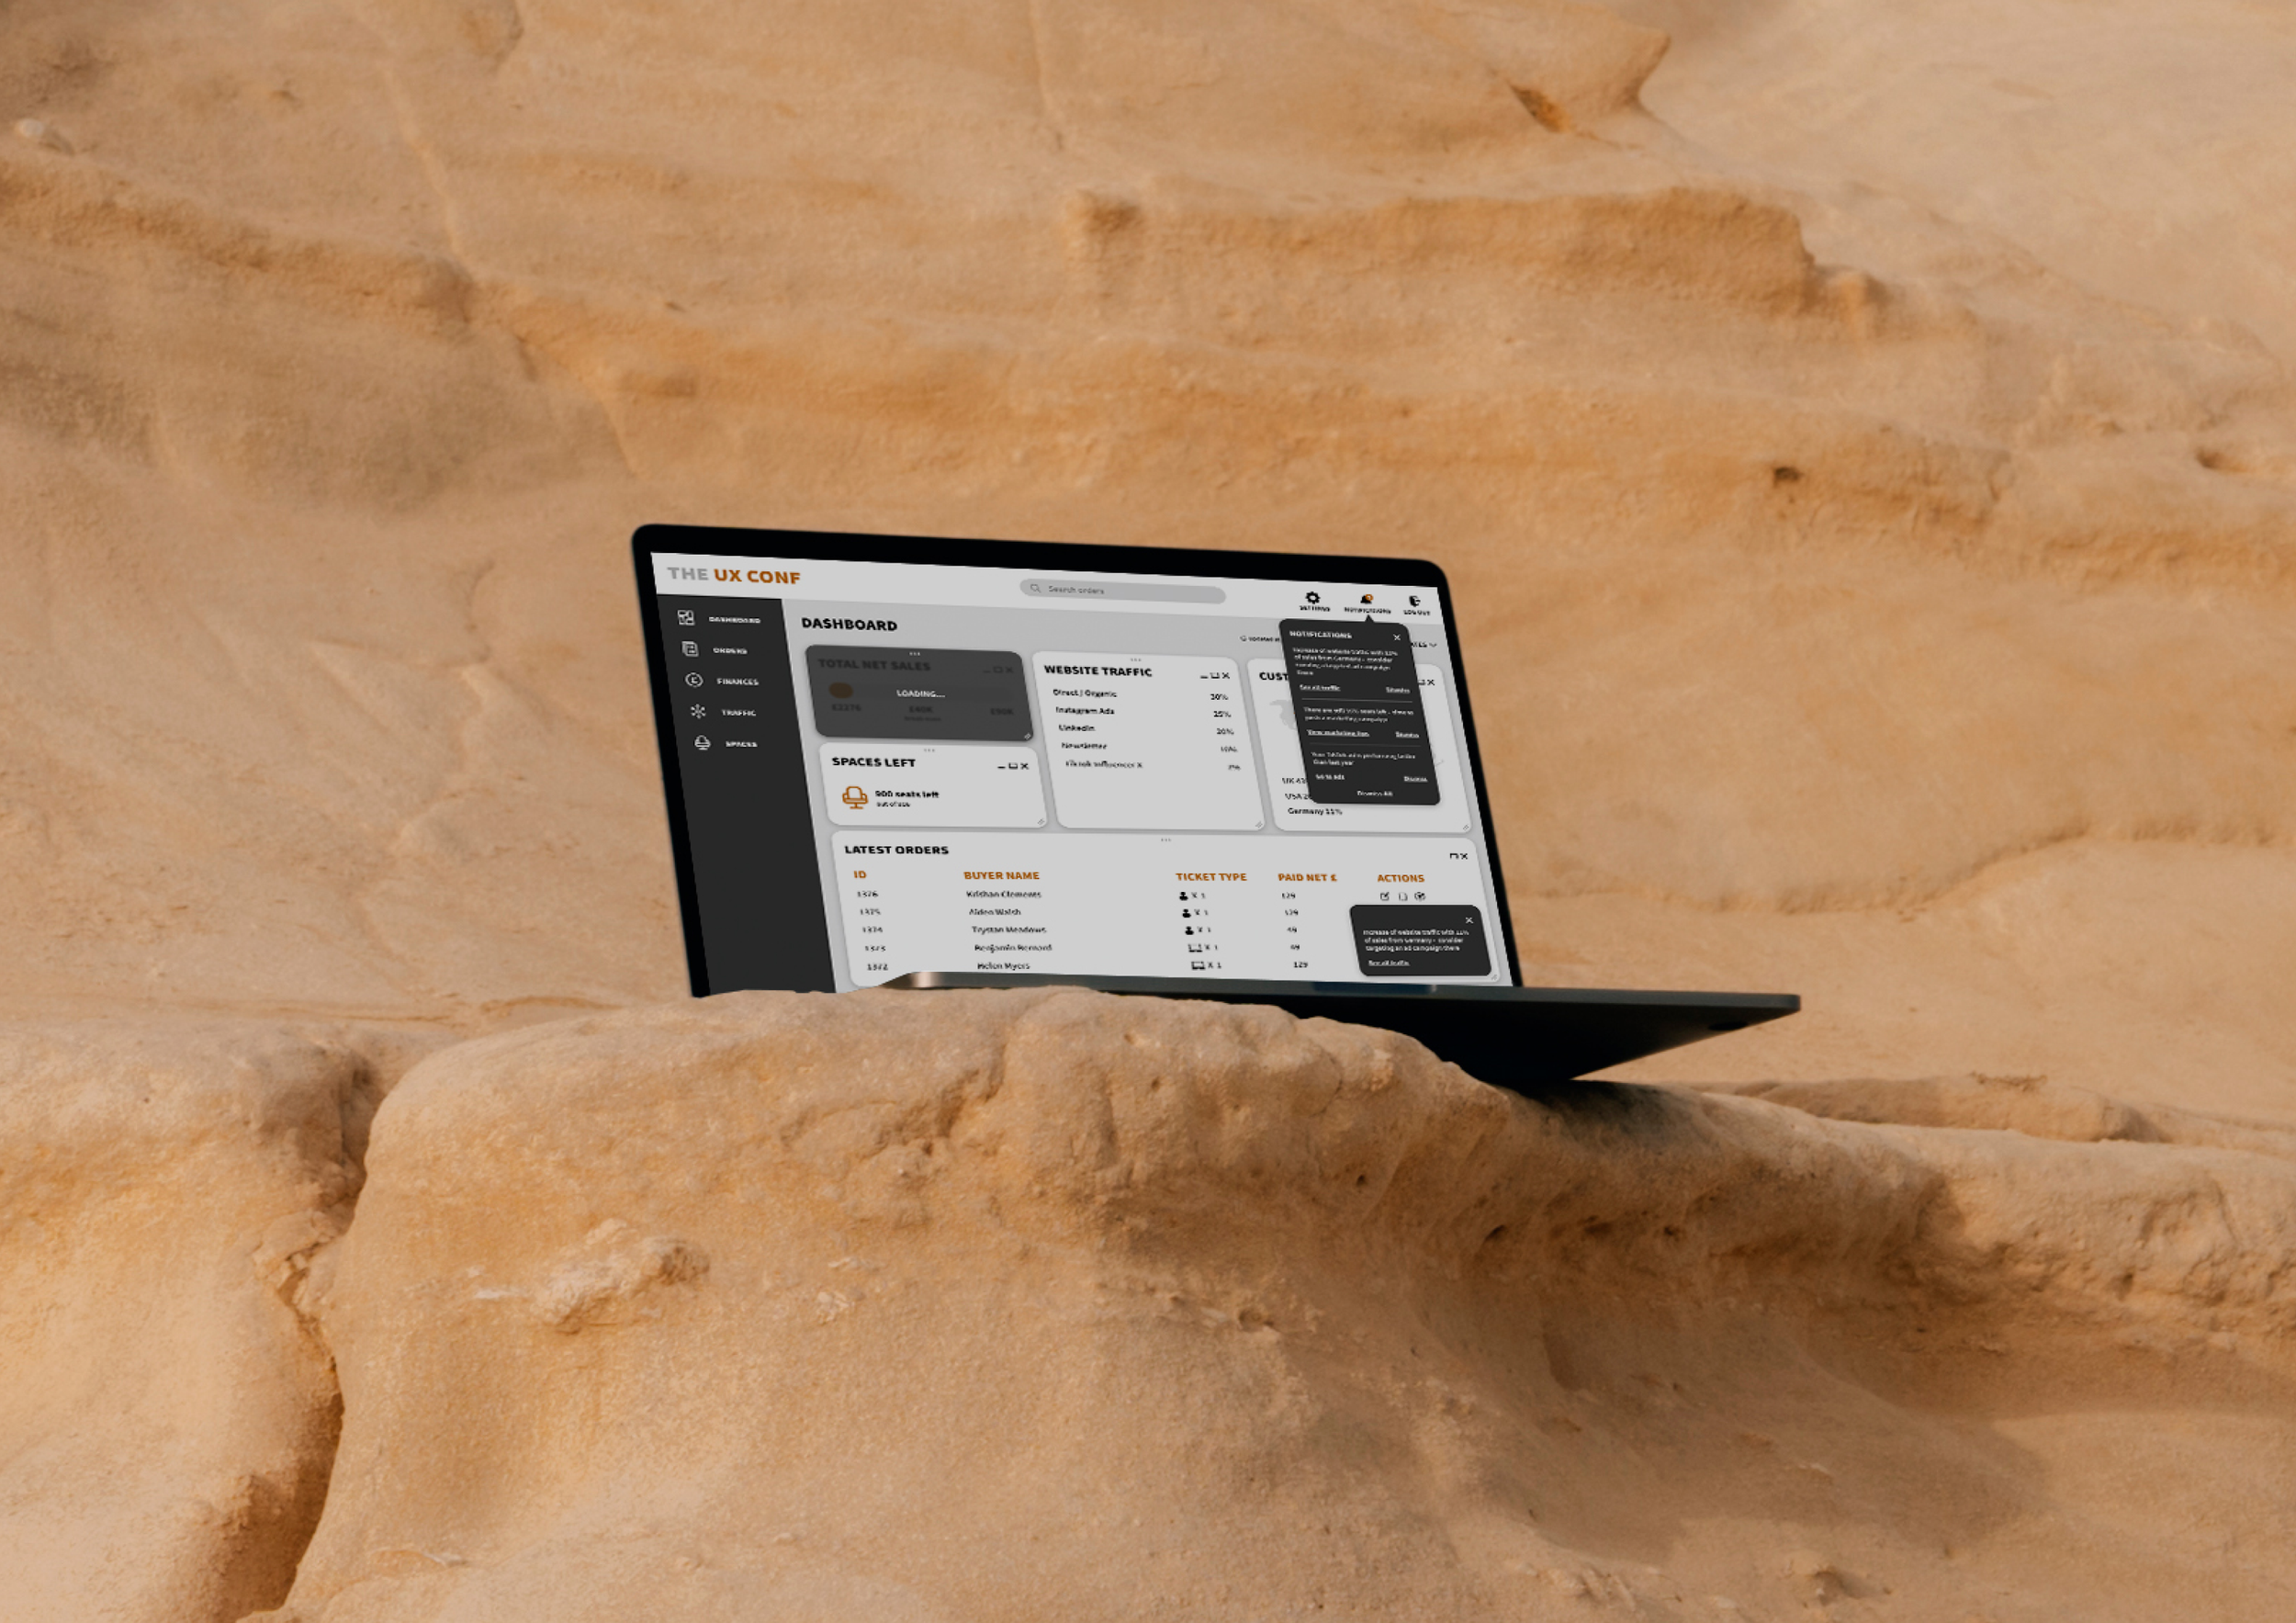
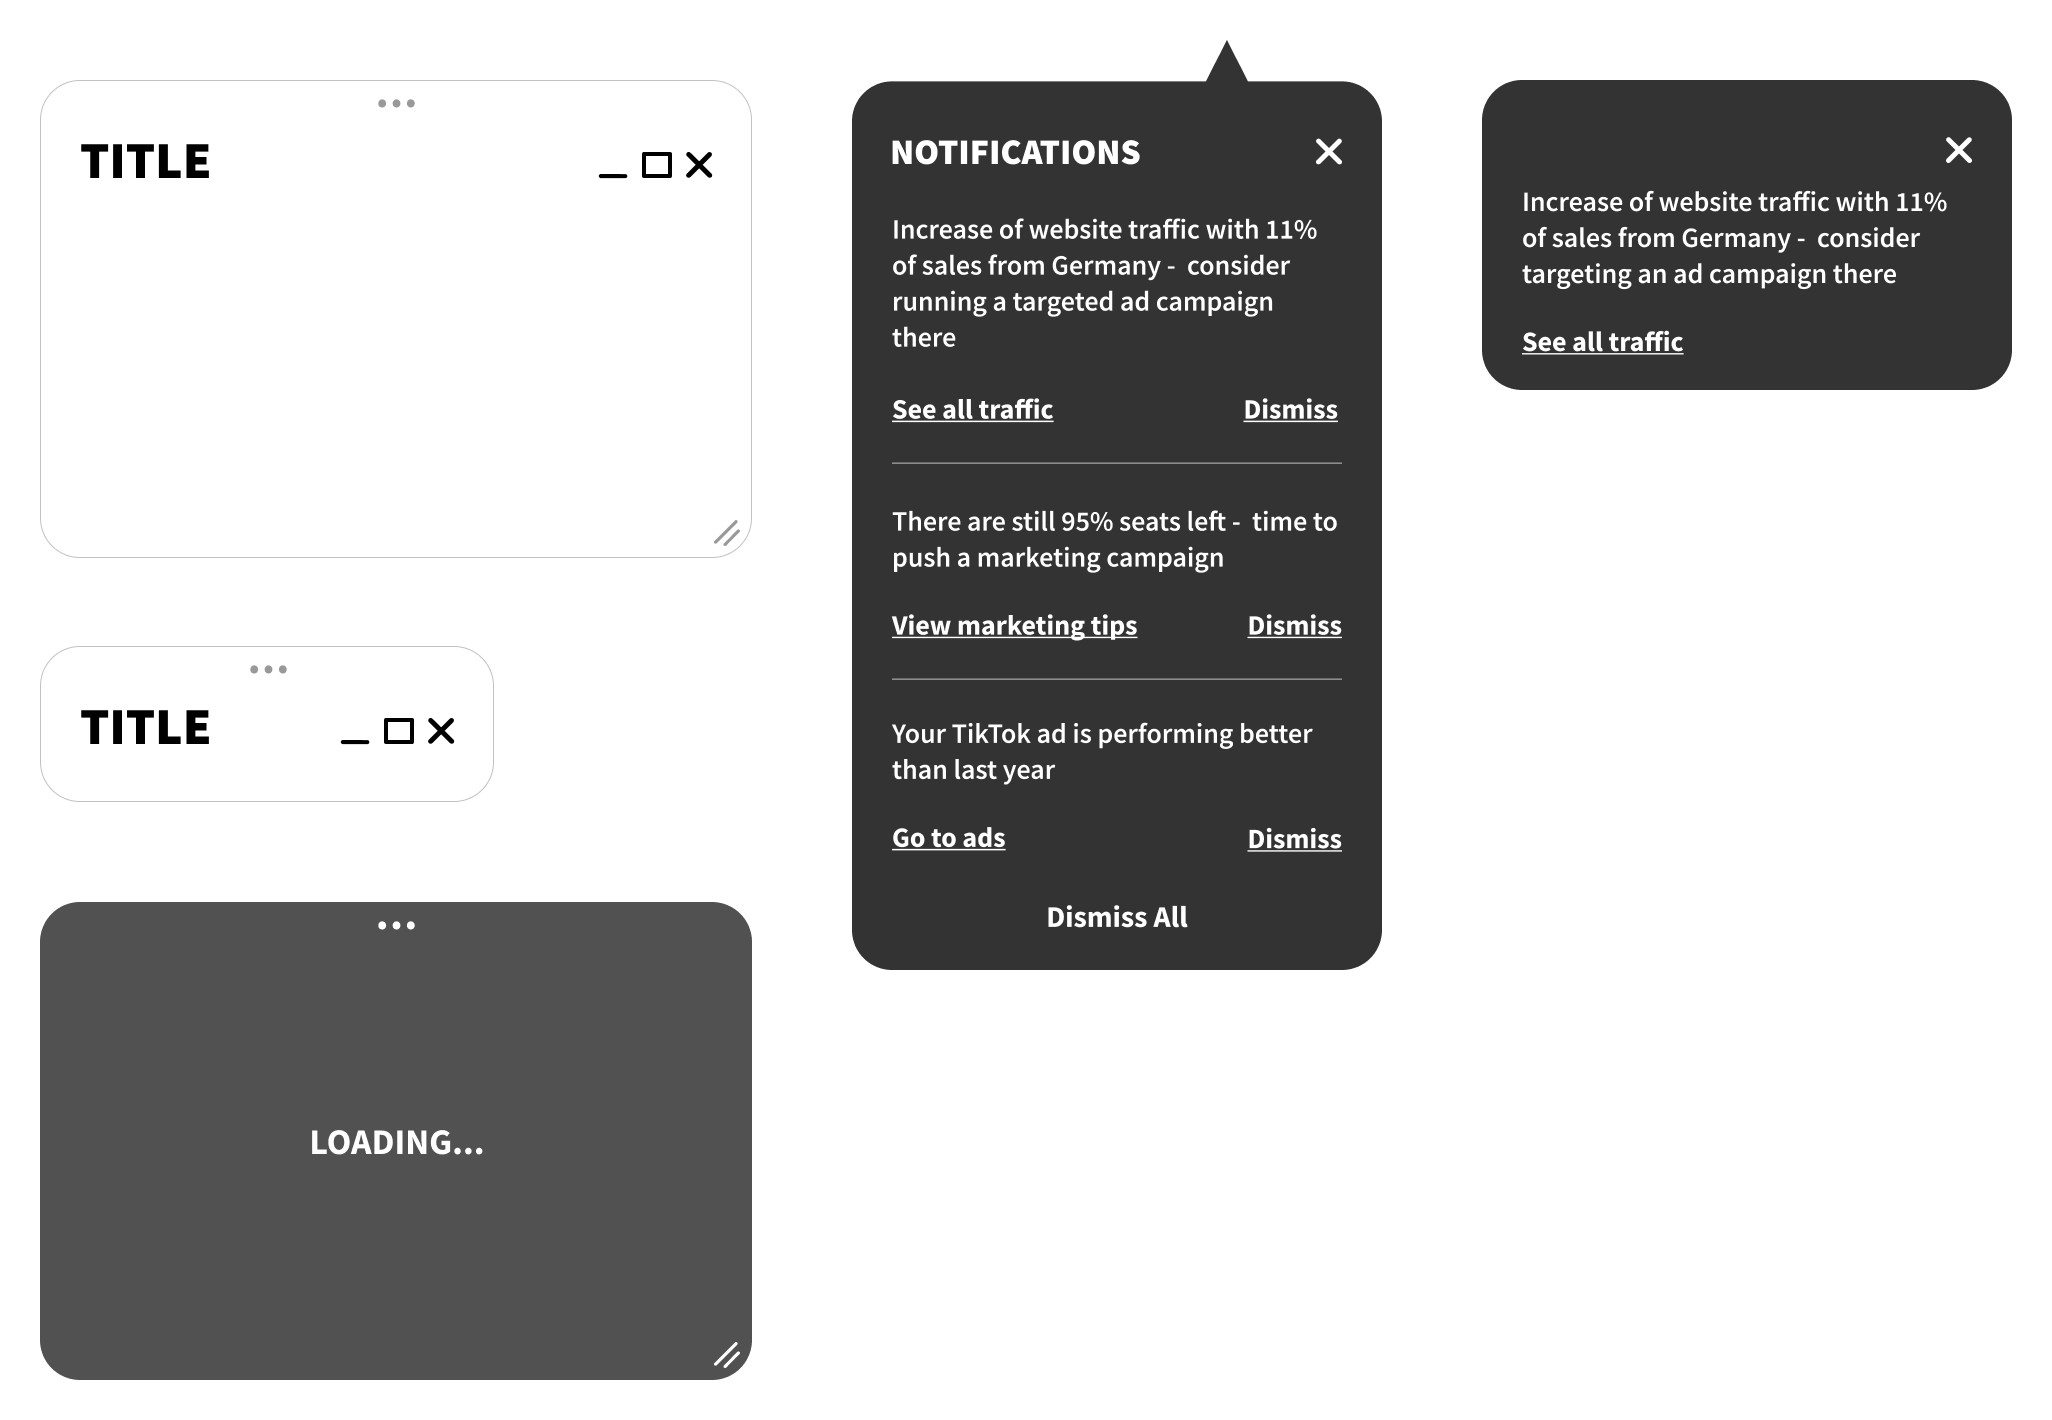
Components
I created interactive components and tiles that allow users to drag, collapse, expand and close sections for a personalised experience.
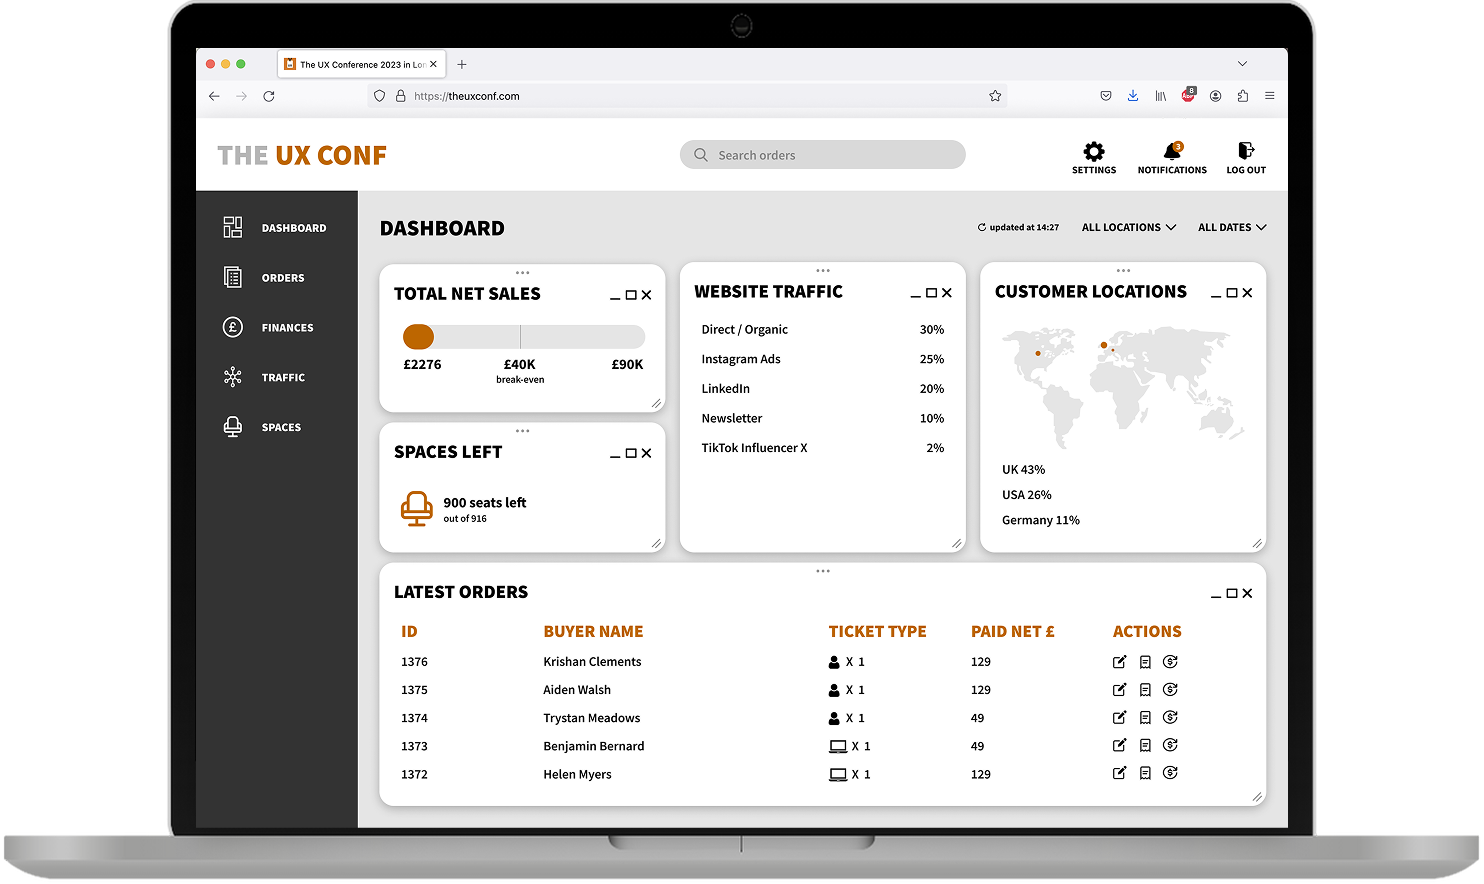
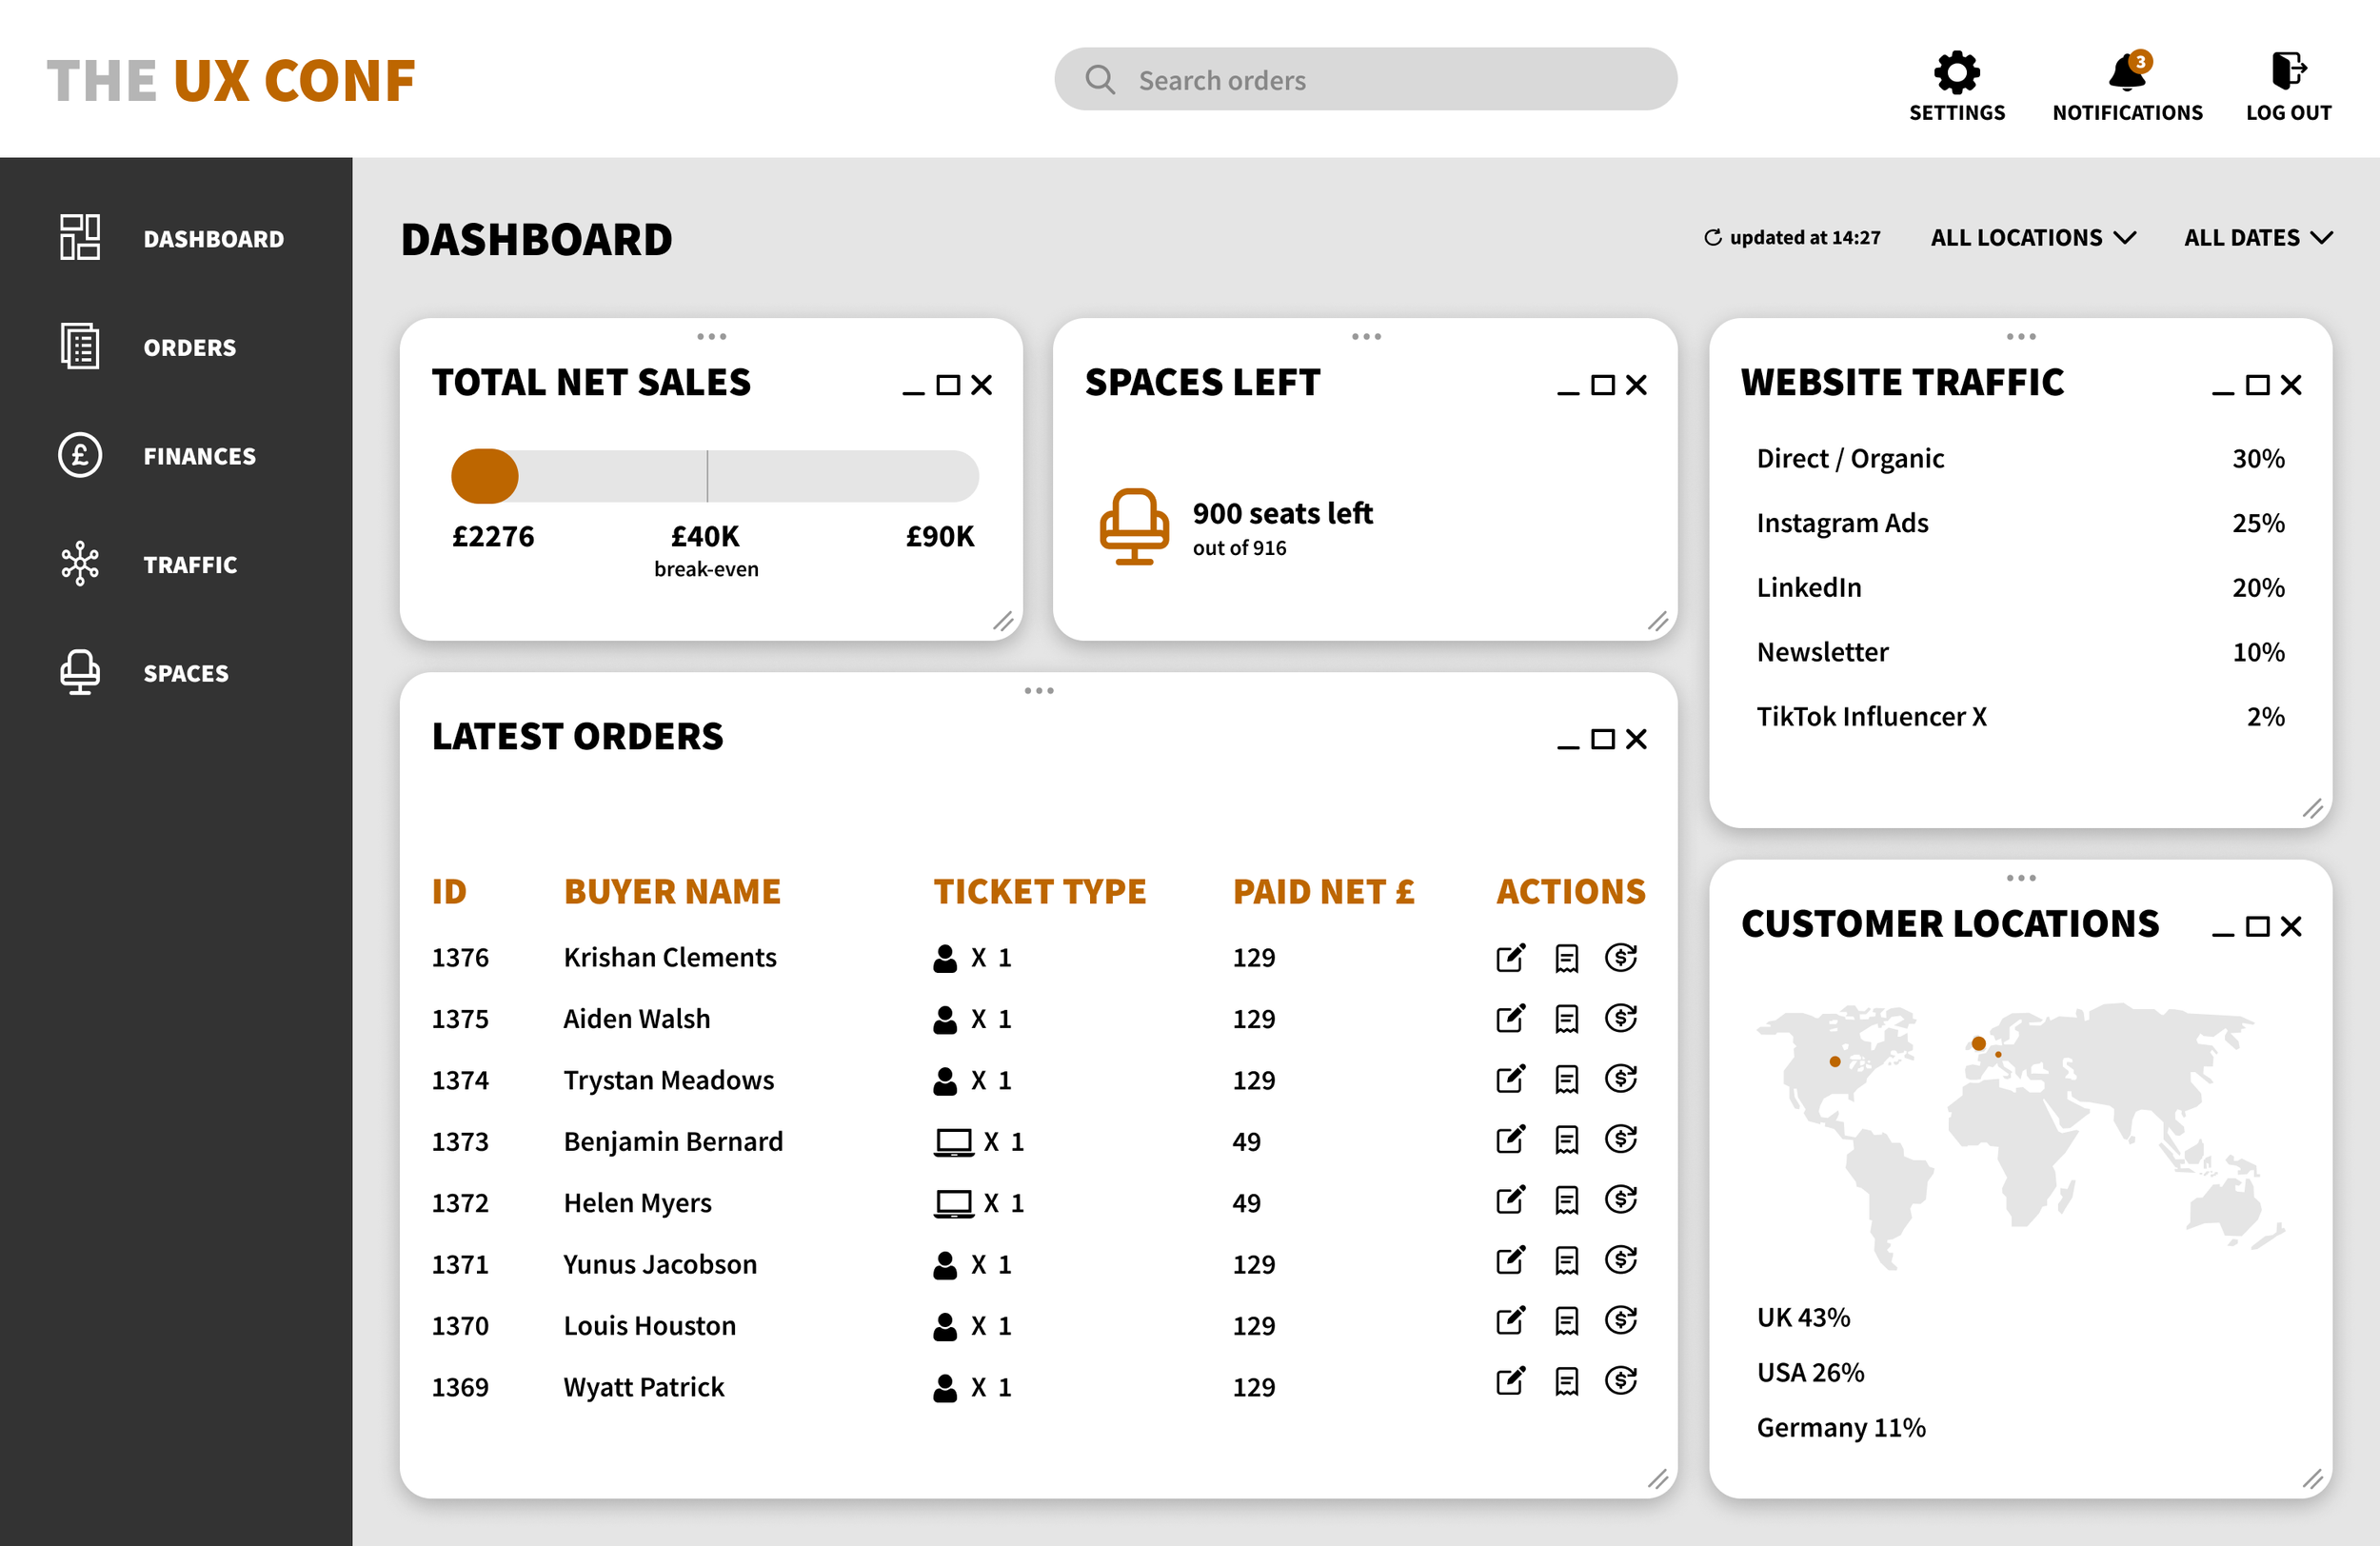
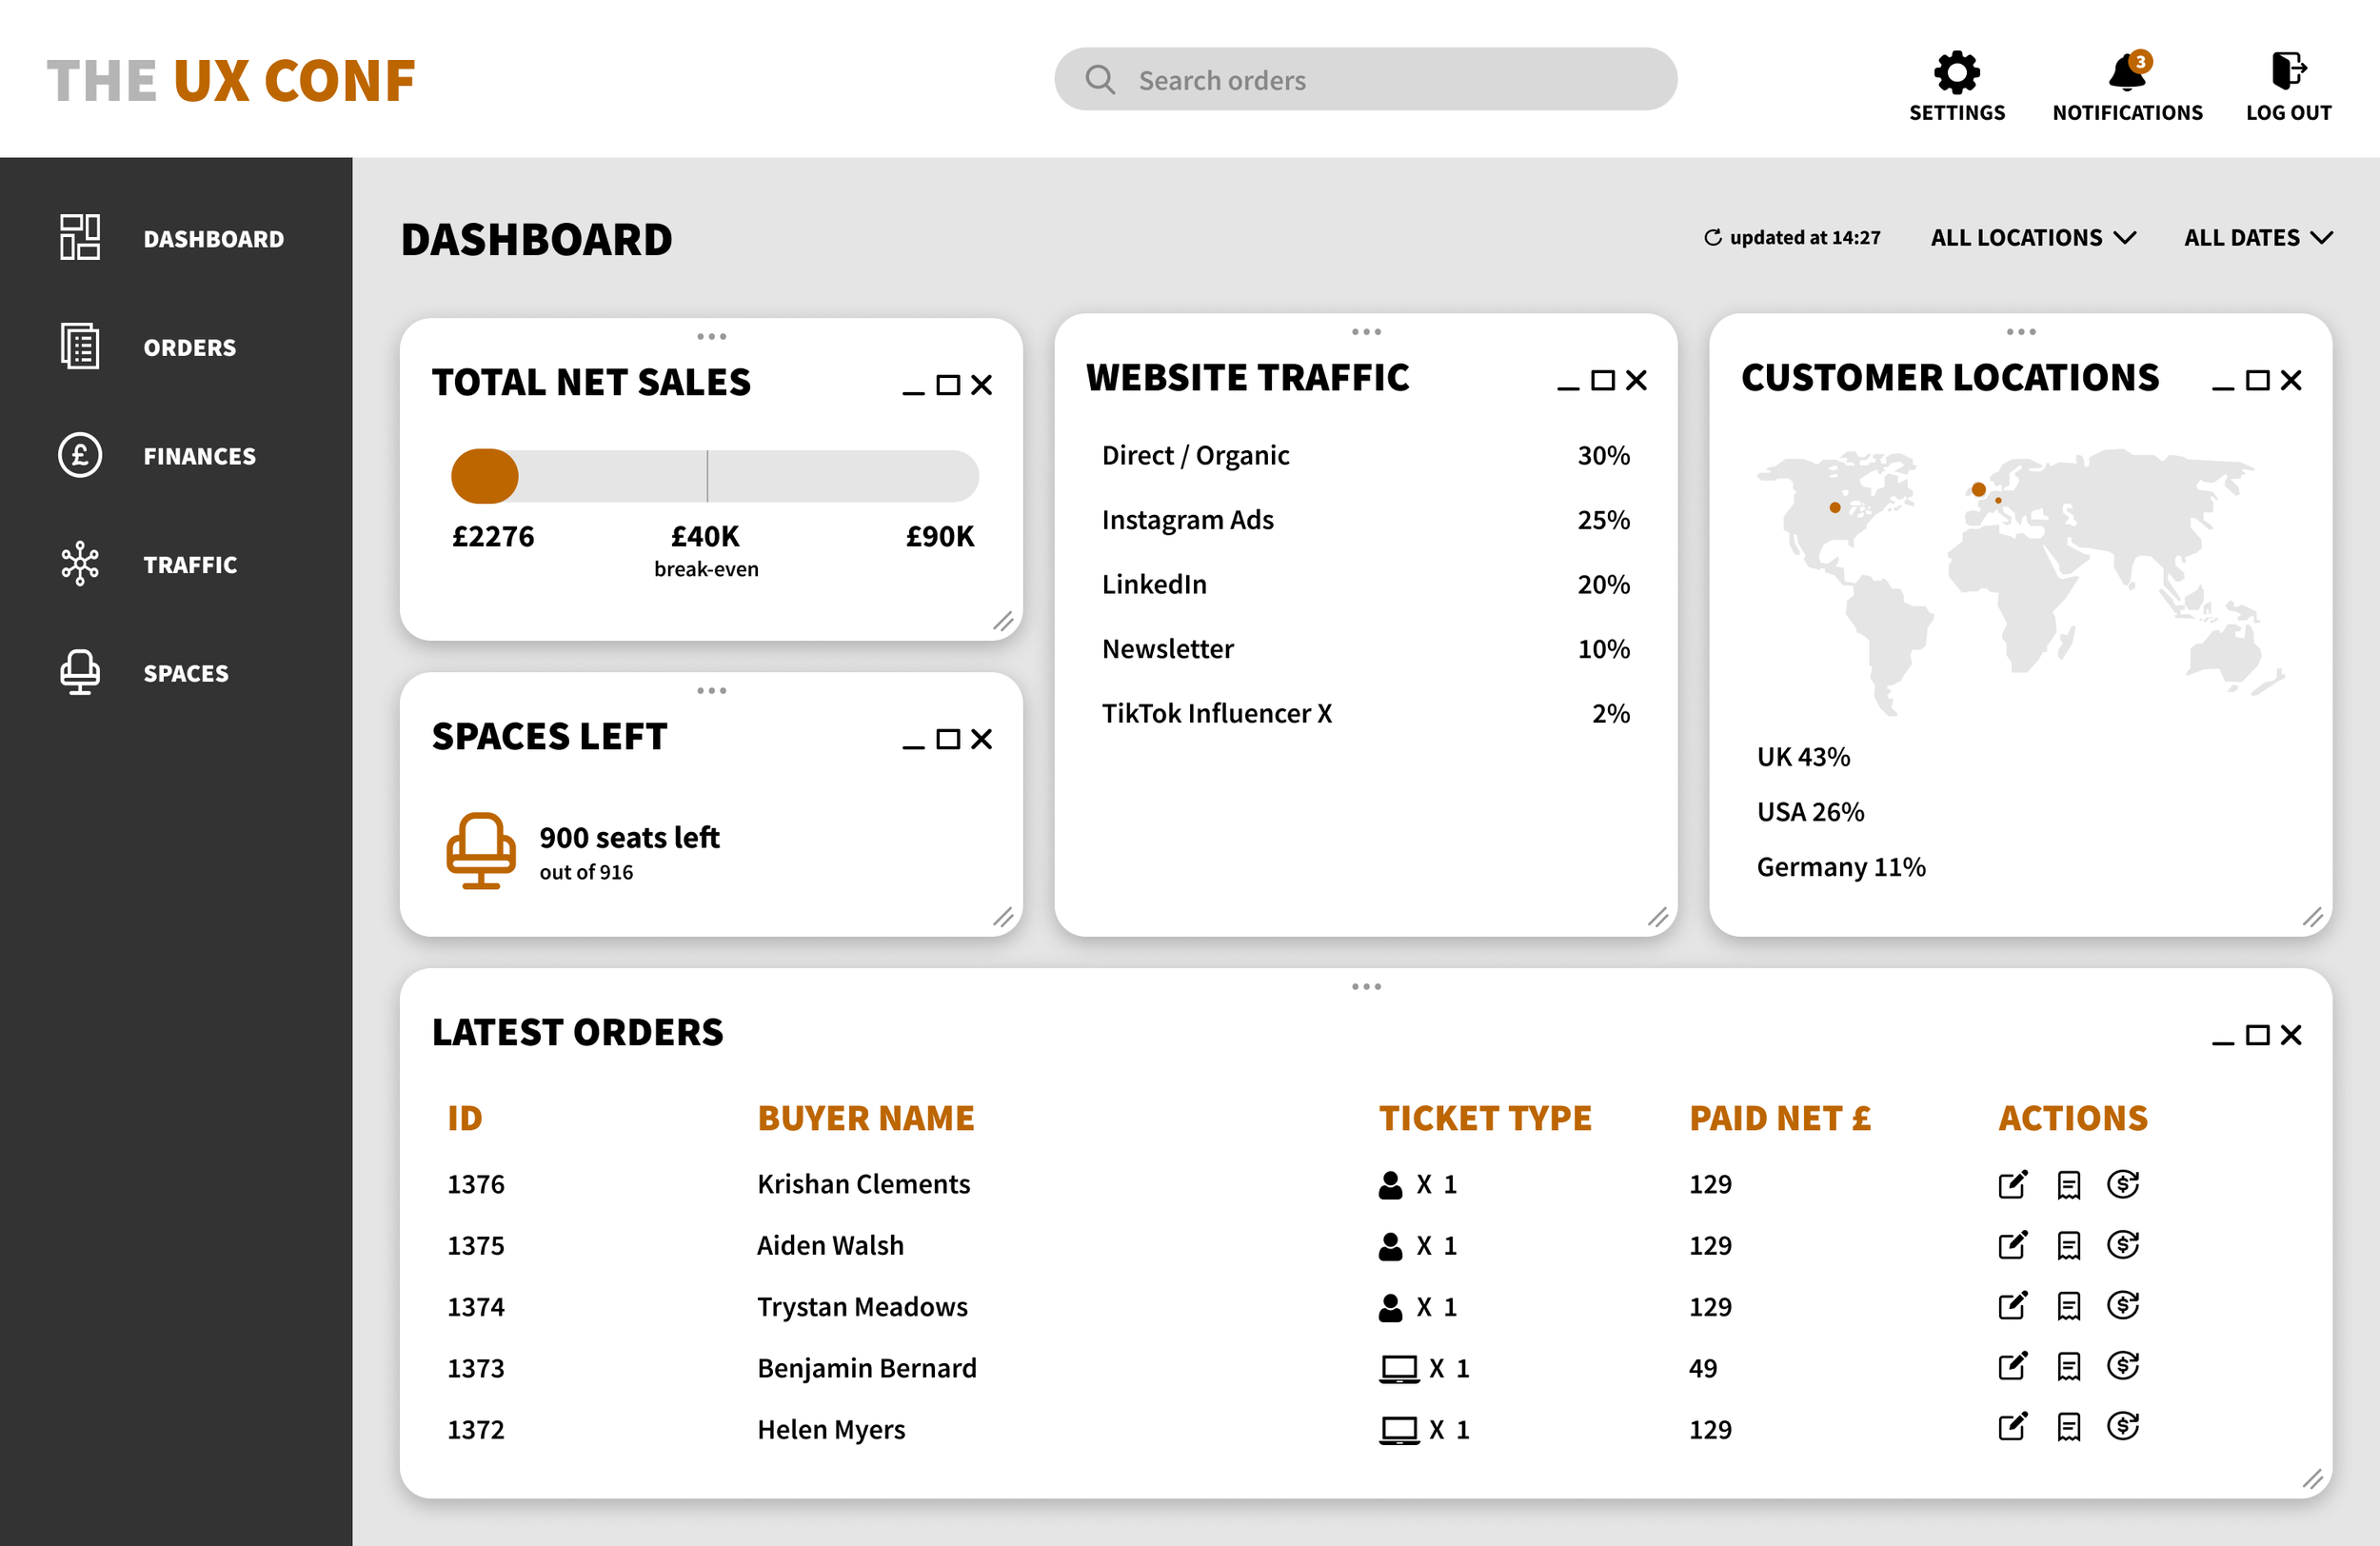
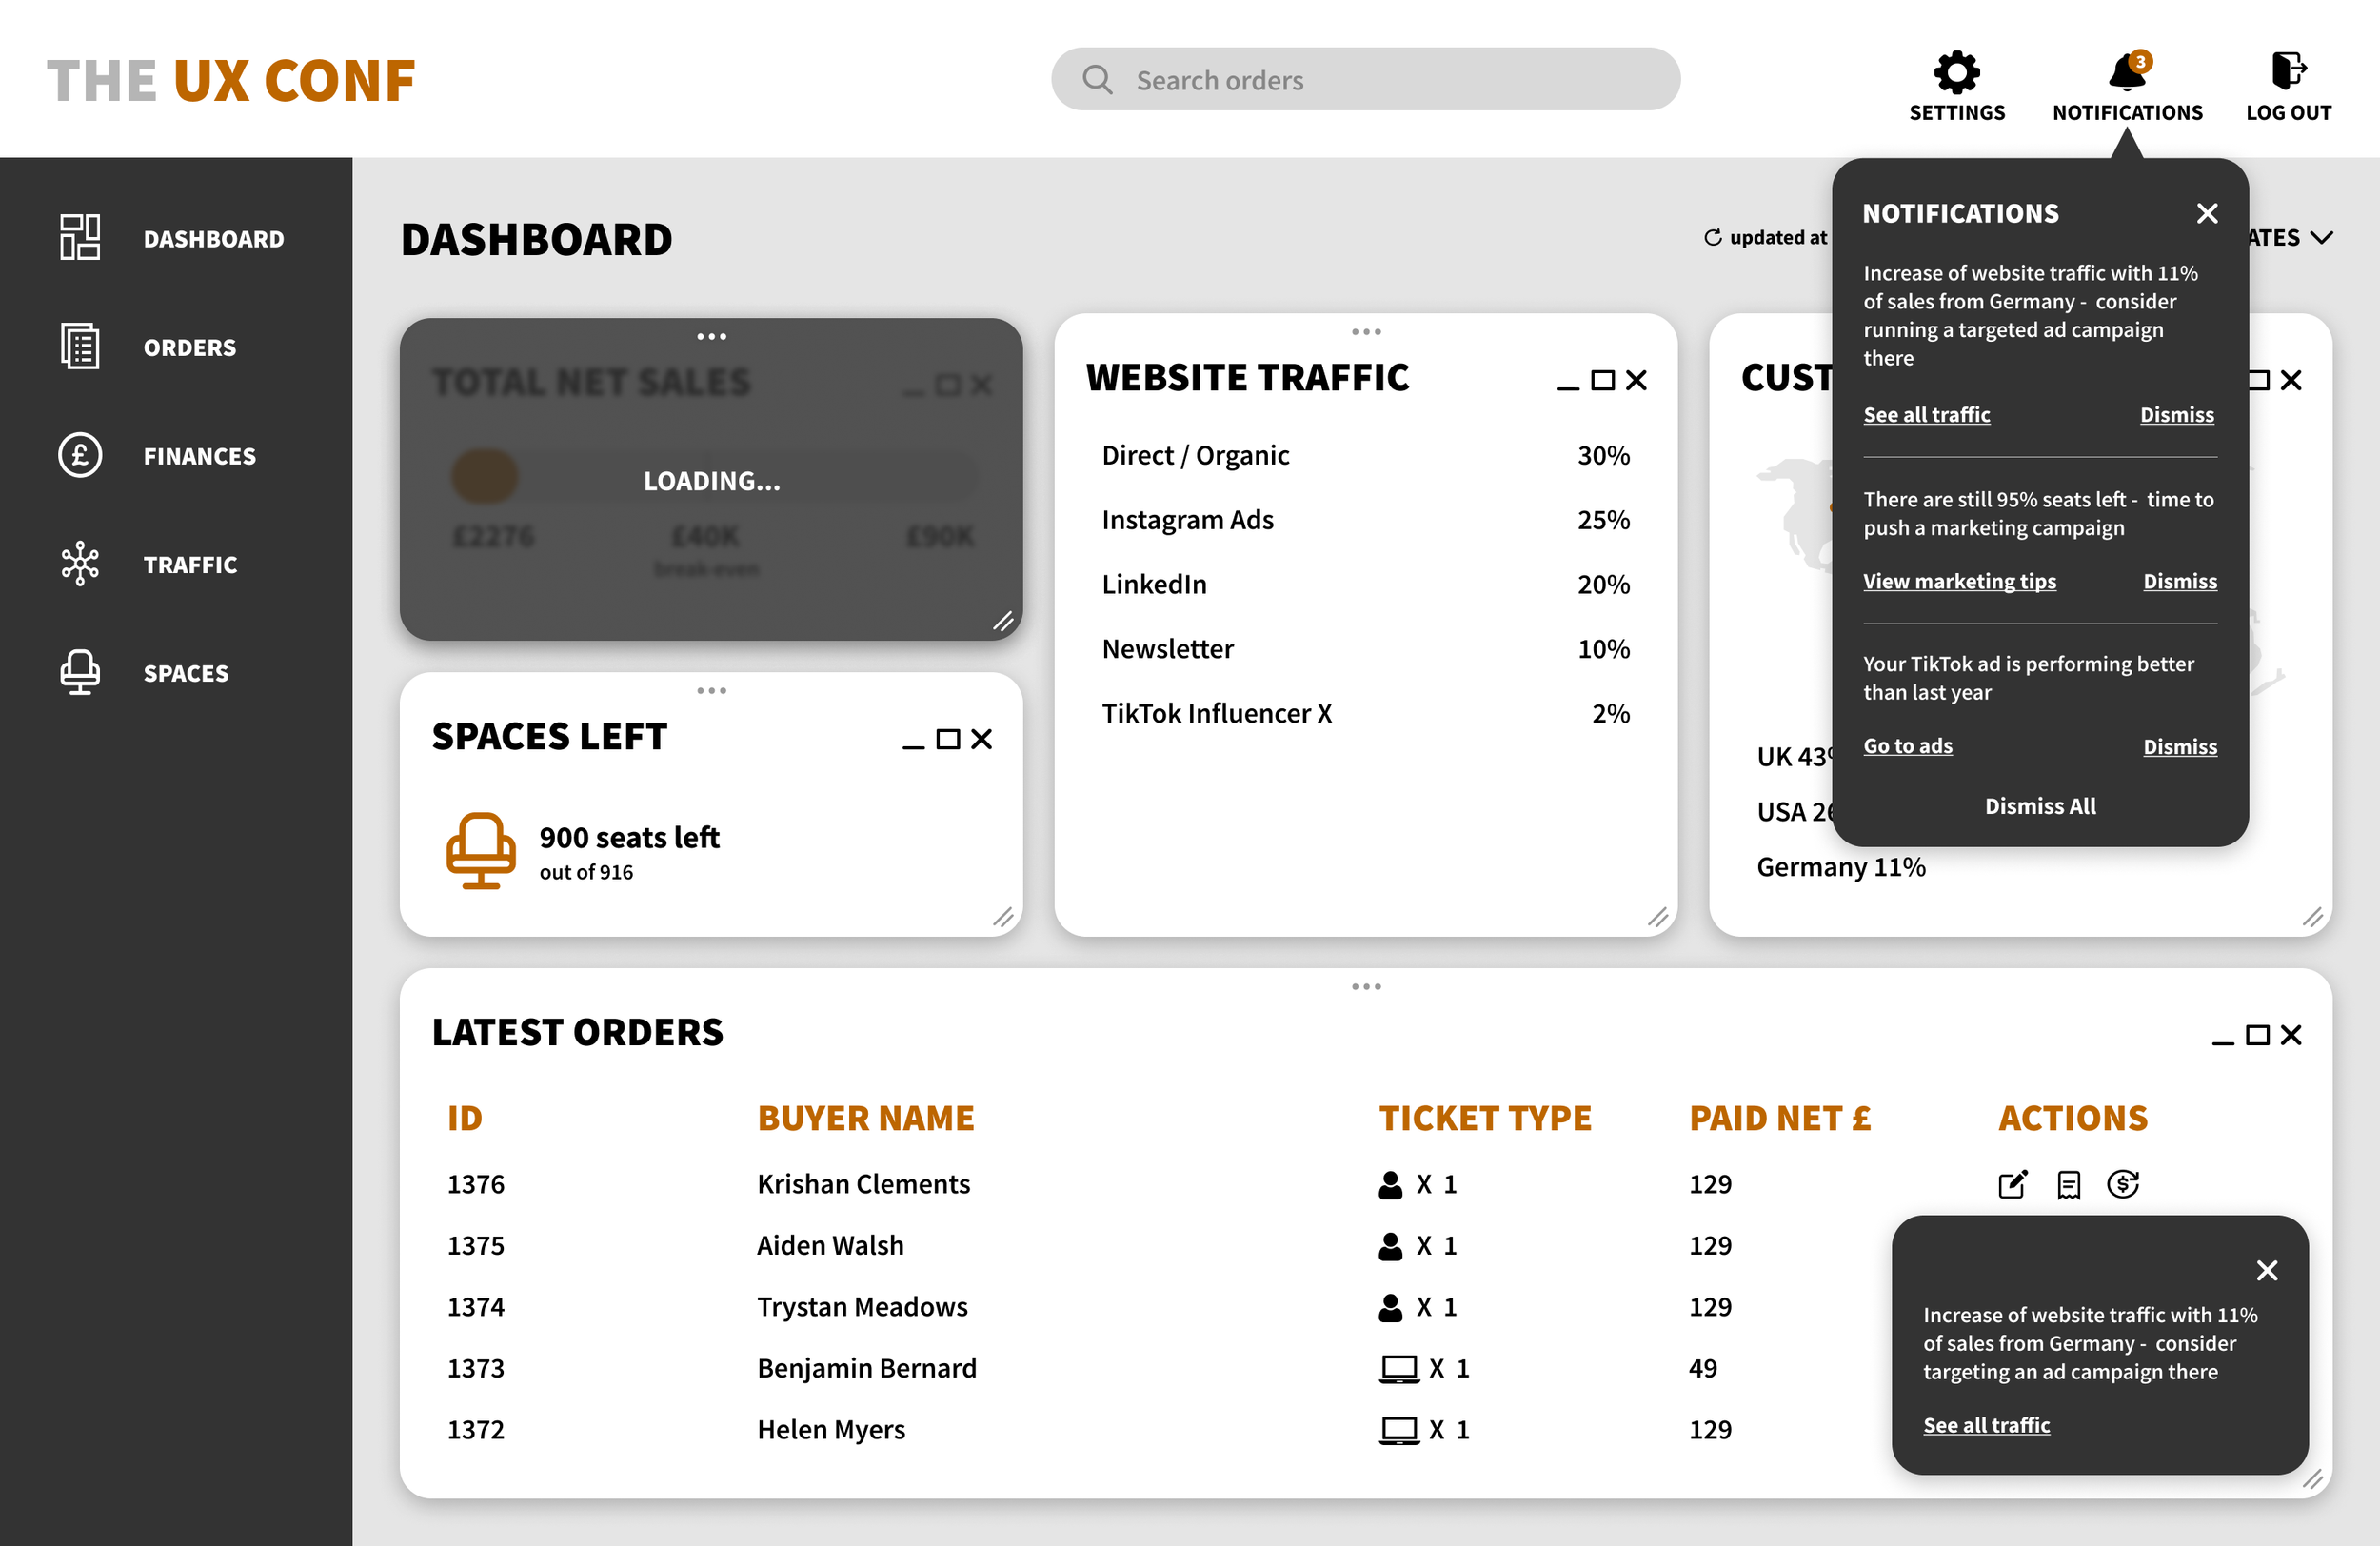
High-Fidelity Prototypes
Project Insights
I found this project to be an enjoyable learning experience. Collaborating with the business to grasp the problem at hand was very insightful. The project solidified the importance of prioritising data and content first, followed by layout and interactions. This ensures all necessary elements are effectively displayed on the dashboard.
Next Steps
To ensure the dashboard truly meets the needs of the business, the next step would be to conduct usability testing with real users. This will validate the designs effectiveness by presenting solid data. Following user testing, I would make necessary adjustments to the dashboard based on the valuable feedback received.